
Review roast history and compare curves in Factory
Roasts is the archive of every finished batch, with its recorded curve, events and weights. Open a roast to replay it, compare it with the profile and the last few batches on the same machine, and decide what to change next time.
7 min read Updated October 19, 2026
A scheduled batch becomes a roast when it is charged and is completed when it is dropped and weighed out. Nothing in the archive is typed by hand: each row is the captured run with its samples, setpoints, events and weights. Use Roasts to check details a week later: what you did on the batch the cafe loved, and what changed on the one they sent back.
Find the batch
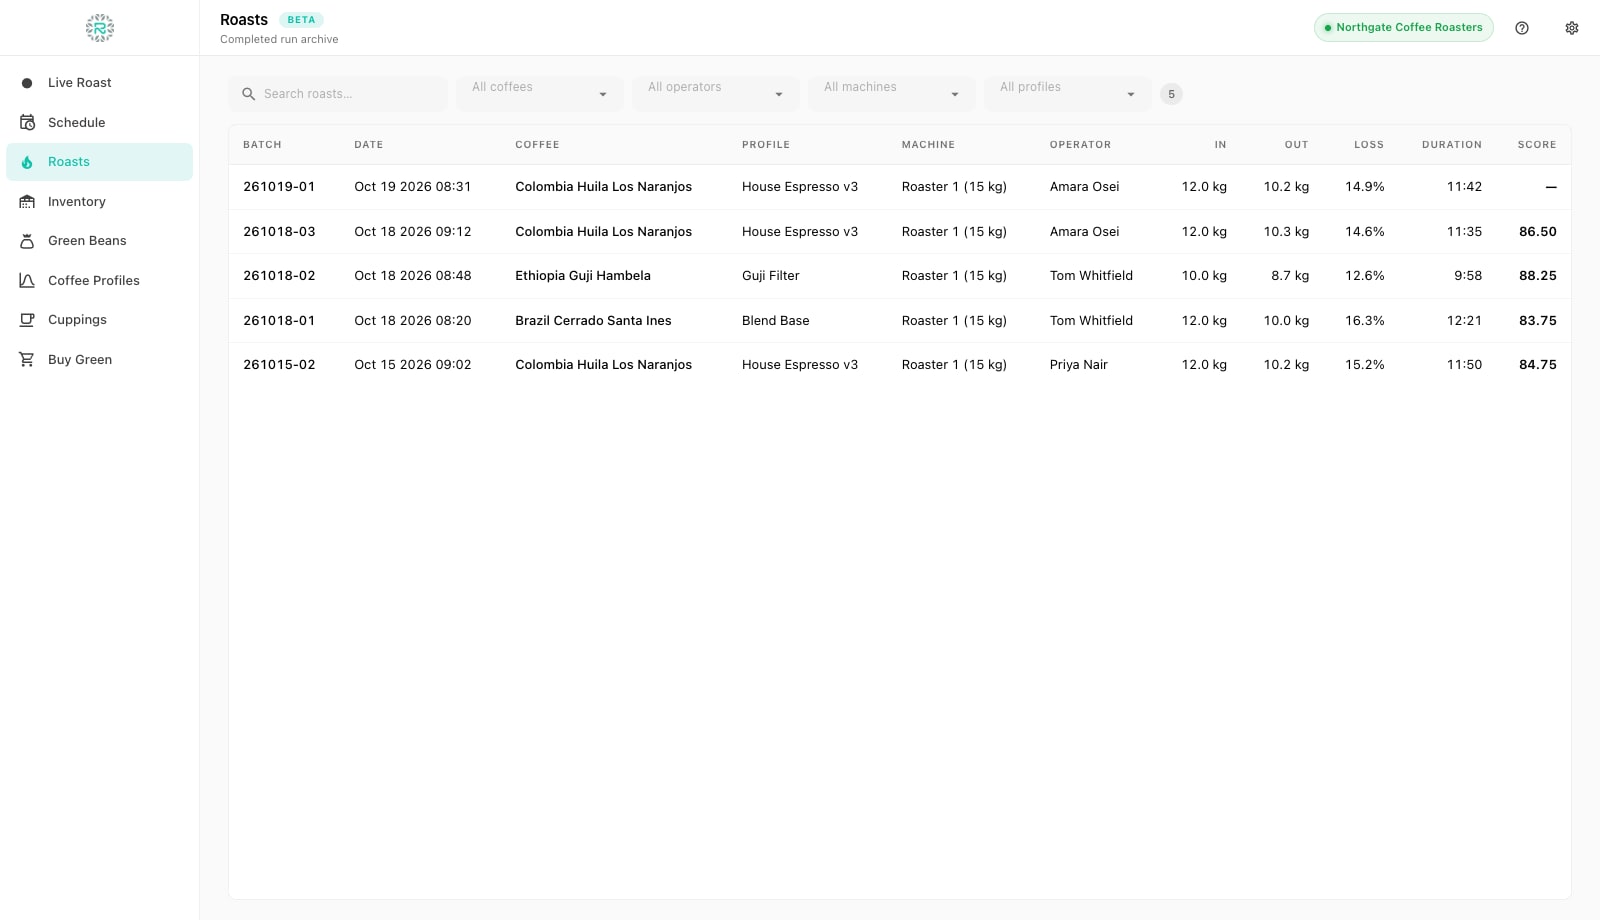
The Roasts list shows Batch, Date, Coffee, Profile, Machine, Operator, In, Out, Loss, Duration and Score, newest first. Search by batch number or coffee, and filter by coffee, operator, machine and profile. The Score column fills in once a cupping is attached to the batch. Roasts completed on the web or on another install also appear when connected, with the fields carried by the schedule. Roasts captured on this device open with their full curve.
Read one roast
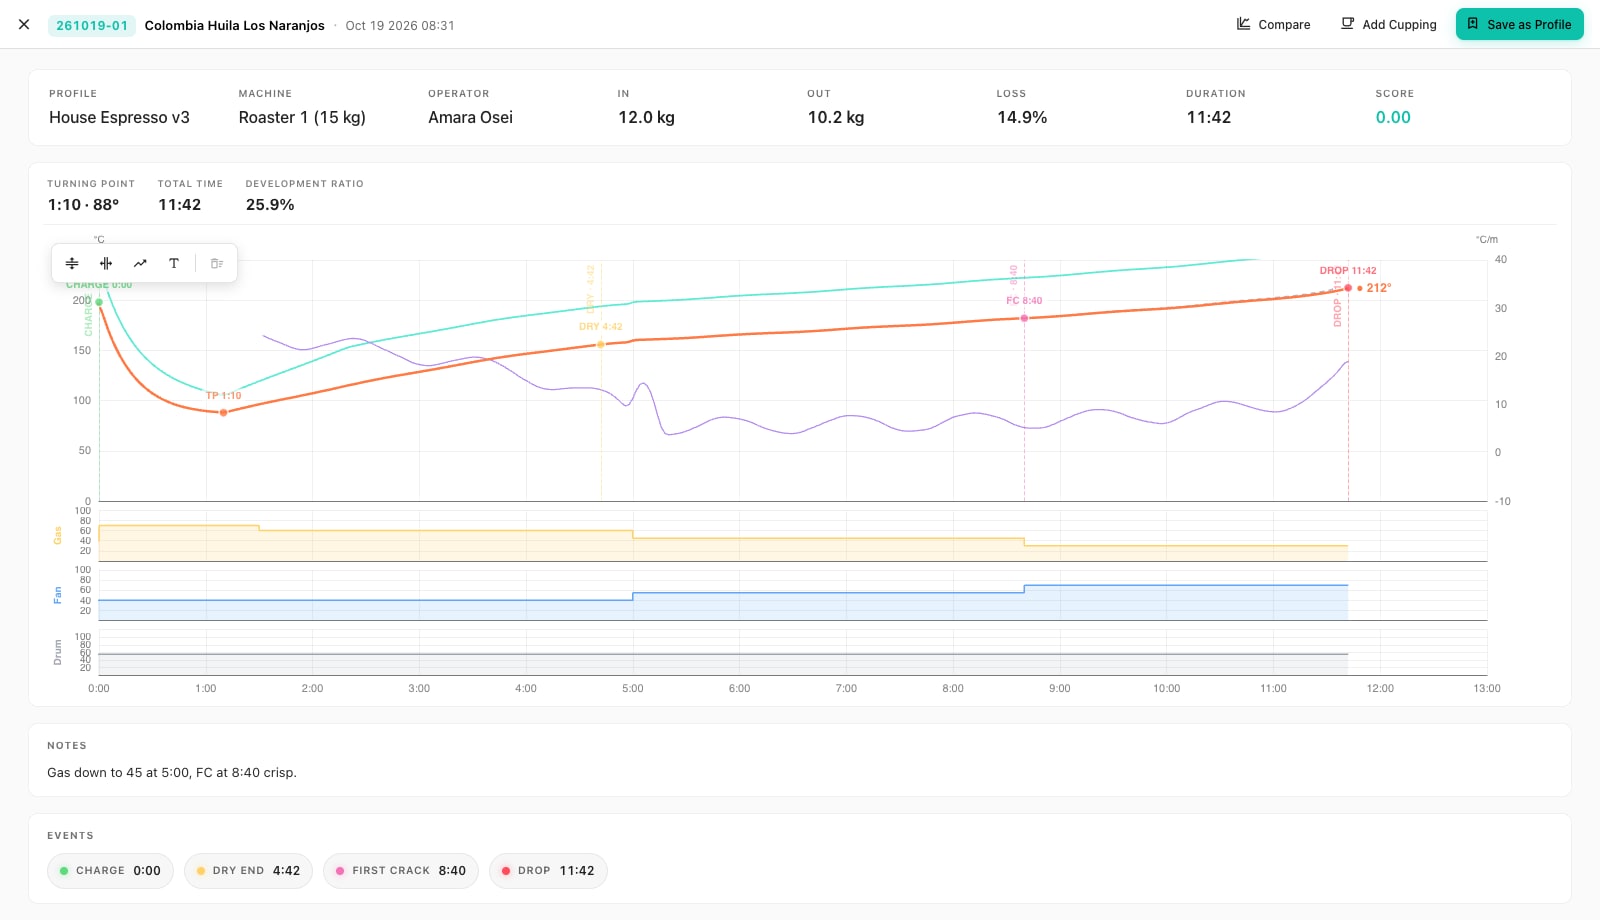
- Click a row. The detail opens with the batch number, coffee and start time in the title and the headline figures across the top: Profile, Machine, Operator, In, Out, Loss, Duration and Score.
- Read the three analysis figures: Turning point (the time and temperature where the bean curve stopped falling after charge), Total time, and Development ratio (time after first crack as a share of the whole roast). A development ratio drifting between batches of the same profile is the first thing to check when the cup changes.
- Replay the chart. Bean, air and rate of rise sit on the main plot with a marker at Charge, Dry End, First Crack and Drop; gas, fan and drum lanes sit underneath, from the machine feed where it sends them, otherwise from the faders you moved. With Zero-lag review curve on in Preferences, Chart, the rate of rise is re-smoothed with no time shift so events sit exactly where they happened.
- Mark it up with the analysis tools above the chart: a Horizontal line at a temperature, a Vertical line at a time, a Trend line between two points, or a Text note. Markup is saved with the roast on this device, and Clear all removes it.
- Read the Notes written at weigh-out and the Events strip with every marked stage and its time.
- Act on it: Add Cupping to score it, Save as Profile to make it the recipe, or close and schedule the next batch with that profile.
Compare curves
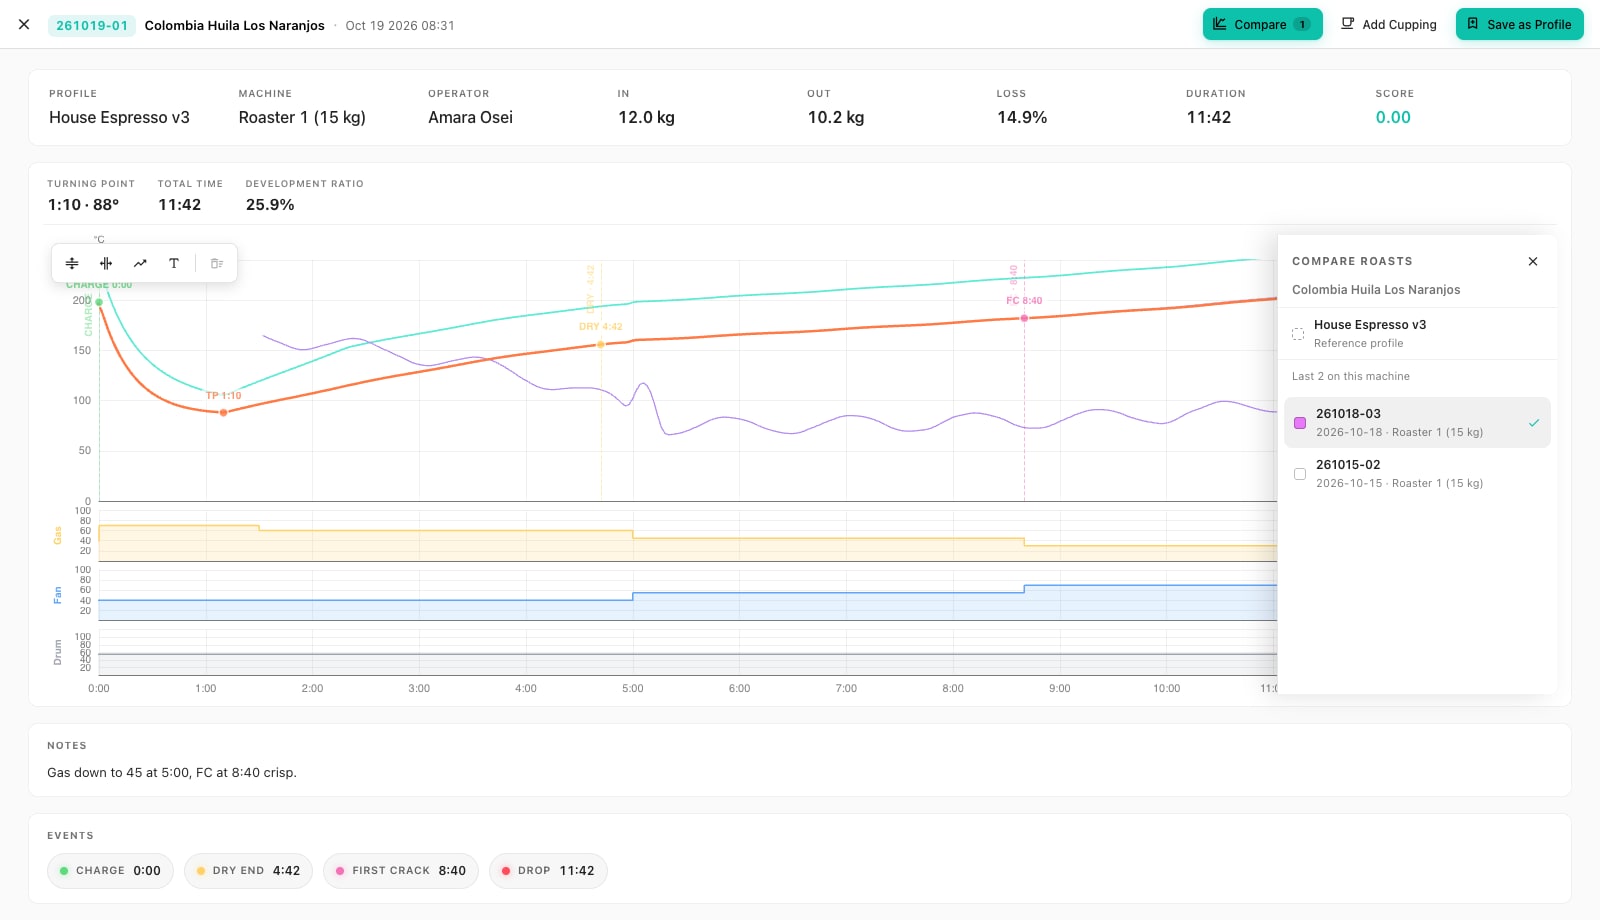
Press Compare in the top right. A panel lists the available comparisons: the Reference profile (the coffee profile used for the batch, drawn from its saved curve) and, under Last N on this machine, recent roasts of the same coffee on the same roaster. Show all expands the list to every roast of the coffee. Tick a candidate to overlay its bean curve on the chart, aligned at charge. Factory limits the overlay to a handful of curves to keep the chart readable; untick one to add another. The Compare button shows how many are selected.
A review habit that works
- Same coffee, same machine, last three batches. This comparison reveals drift before the cafe notices.
- Loss first, then the curve. A loss a point away from the profile's average indicates which phase to check.
- Development ratio against the profile. If the ratio changed, first crack or drop moved; the Events strip shows which.
- Write it on the roast. Add a text note to the chart at the point you would change, rather than relying on memory.
- Promote the winner. When one batch cups best, Save as Profile and archive the old version.
Reviewed, not just archived
- Batch found by number or coffee, not by scrolling
- Turning point, total time and development ratio read before the curve
- Compared against the reference profile and the last batches on this machine
- Markup or a note left for the next roaster
- Best batch saved as the profile
Where Roastnet helps
Questions roasters ask
- Why does a roast open with no curve?
- It was completed without a connected feed, or on another device. The detail still shows the weights, timings and notes and states that no curve was recorded. It never shows an invented curve.
- How many curves can I overlay?
- A handful at once, enough for the reference profile and the last few batches. The panel tells you when the limit is reached; untick one to add another.
- Is the markup shared with the team?
- Chart markup is saved with the roast on this device. Notes written at weigh-out sync to Roastnet with the roast and are visible to everyone.
- Can I export a roast?
- Use Capture Chart from the app menu to save the chart as an image to your screenshots folder. Use the Roastnet web app for the full batch record.
Read next
Create a coffee profile in Factory and roast to it
A coffee profile is a roast you want to repeat, saved with its curve, timings and targets. Factory builds one from a real batch in two clicks, then draws it as a ghost line in the cockpit so the next roast can follow it.
Roast profiling basics for consistency, not just flavor
A profile is a recipe that anyone trained can repeat. The business value of profiling is not one perfect batch, but the same good batch every week on any shift.
Record a cupping in Factory and score the roast
A roast curve tells you what you did. A cupping tells you whether it worked. Factory attaches a scored cupping to its batch, so the best-tasting roast of a coffee is recorded alongside its curve.
Run the roastery from one place
Green stock, roast plans, wholesale orders and the green coffee market in one platform, with a free roast-logging app for your machine.